Business Intelligence
Business Intelligence
Business intelligence is a broad term that encompasses all of the tools and practices used to collect, structure, analyze, and transform raw data into actionable business insights. BI is concerned with methods and tools for transforming unstructured data sets and compiling them into easy-to-understand reports or information dashboards. Most BI analysts and organizations require BI tools to stay ahead of competitors and optimize overall performance. The ultimate goal of BI is to continuously monitor business performance in order to ensure that an organization stays on track to meet its strategic objectives. It enables decision-makers to make course corrections if necessary.
Why your organization need BI services:
- More efficient and accurate reporting, analysis, and planning.
- Better business decisions.
- Improved data quality.
- Improved operational efficiency.
- Improved both customer & employee satisfaction.
- Increased competitive advantage.
- Lowering costs and increasing revenues
- Identifying market trends.
- Provide Valuable business insights & Competitive analysis.

Data sources
Your data source channels can be:
• Data from stakeholder
• Data from industry-wide analytics
• Information from your employees and departments
• Google Analytics, CRM, ERP

Process you need to follow to start adopting BI in your company:
- Start from Introducing business intelligence to your employees and stakeholders, then Setting out the objectives, KPIs, and requirements.
- Choose tools (Tableau & Congo’s & Power BI) or decide on a custom solution.
- Assemble a team of employees from various areas inside your organization to work on your business intelligence strategy.
- Once you have a team and you’ve considered the data sources required for your specific problem, you can start developing a BI strategy.
- Then you need to configure a data warehouse and choose an architectural approach.
- Finally, you can implement the end-user interface: reporting tools and dashboards, Conduct training for your end users.
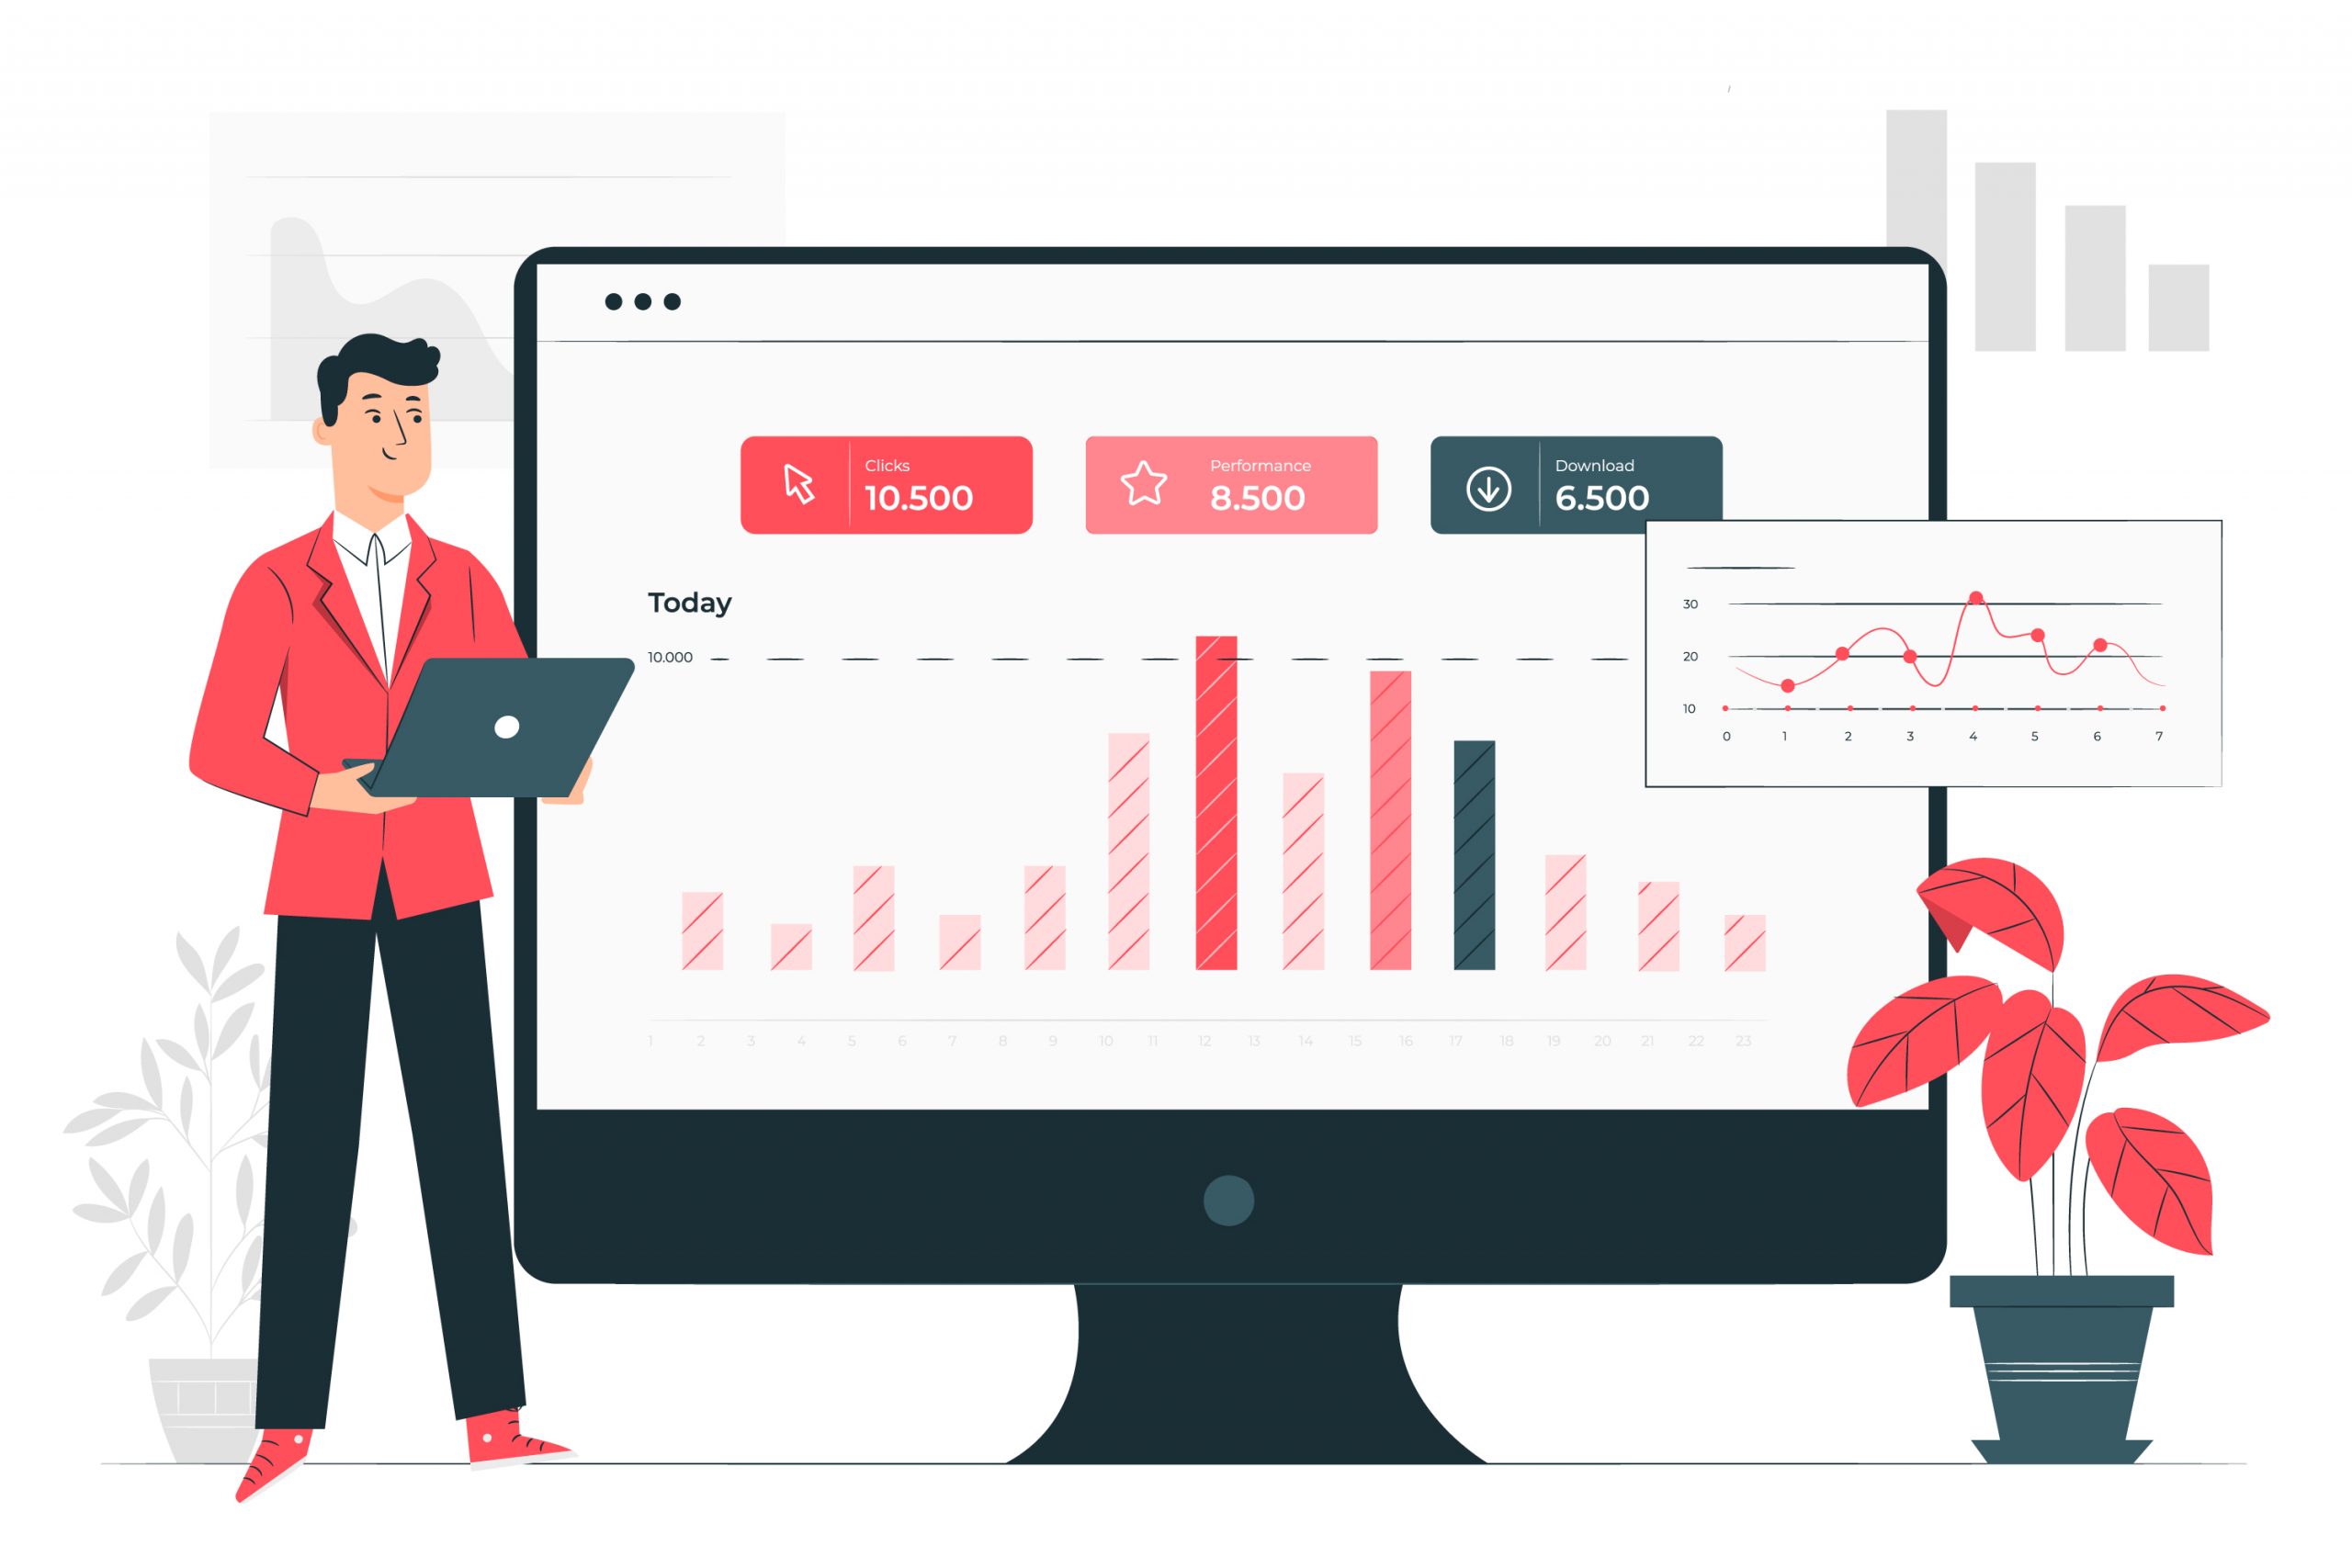
BI Dashboard
As a part of initiating your company’s business intelligence strategy. Together with your team, we will help you to design a purpose-built dashboard to analyze data from key datasets in order to improve business decisions. With applying to modern BI you will be able to visualize and analyze your data through one screen display of the status of key performance indicators (KPIs) and other important business metrics and data points for an organization, department, team or process.
Multiple data visualizations are generally included in BI dashboards to provide business users with a consolidated view of key KPIs and trends for both operational and strategic decision-making. They’re more interactive than static reports, allowing users to drill down into the data that underpins charts and visualizations for deeper analysis.
It is possible to create realistic, accurate performance numbers for your business by combining KPIs and Business Intelligence (BI). This eliminates the need for project managers and department heads to manually analyze company performance and adjust KPIs on a regular basis. BI-generated KPIs also result in a more efficient operational process for businesses.
- The members of a BI team.
- Business analysts.
- Users of self-service BI tools.
- A customizable interface & dashboard templates to accelerate the design process and the ability to pull in both historical and real-time data.
- Dashboard tools offer libraries of widgets, icons and images that can be added to dashboards to improve usability and visual appeal, as well as tabs, pull-down menus and other navigation features.
Programs used in BI
Business intelligence software and programs are differentiated by the level of flexibility it gives users to interact with data or by how it helps to provide insights into new business questions or monitor ongoing processes.
To choose what program to use depends upon your organizational requirements, data types, budget, and goals. So here the Key features & benefit of both Tableau & Cognos & Power BI.
Features
- Provide Interactive dashboards and visually appealing reports
- Enhanced chart representation like histogram.
- Enhanced and faster data sharing between different data sources
- Easy to use, great customer support, and effective handling of large data sets.
Benefits
- Assist in making the best data-driven decisions by assimilating data from multiple sources.
- Help unskilled users at data processing by offering a variety of data analytics through visually appealing effects that need no IT assistance.
- Provide a Customizable and secure data exploration of your data.
Features
- Offers its users insightful information through reports (ad hock report)/dashboards.
- Distribute reports in PDF or XML format and provide Good support for large data systems like AWS.
- Offers Efficient and customizable dashboard.
- Provide both prescriptive and predictive analytics.
Benefits
- Demonstrate knowledge of how to manage corporate data and provide the best possible insights.
- Provide a secure view of information of financial performance and data analytics.
- Its output is tailored to many levels of stakeholders, including departments, individuals, middle-level organizations, and businesses.
- Act as an excellent tool assisting users to visualize data through KPI monitoring.
- Reveals patterns and trends to explore relations within data. The report outputs are comprehensive enough to be understood best by data experts.
Power BI is the umbrella term for a collection of cloud-based apps and services that allow businesses to collect, manage, and analyze data from a range of sources using a simple user interface.
Power BI is a business intelligence tool that can be used for a multitude of purposes. It allows your business to visualize its data and share insights. This solution helps your business to handle data from different sources and provides visualization after the cleaning and integration process. It also offers a feature of Ad-hoc report generation, which helps in the analysis of the data.
Power BI tool can also be customized to help your business to convert data from the various data source into interactive dashboards and BI reports. It also provides multiple software connectors and services.
What does Power BI do?
- Run reports and surface insights based on your company’s data.
- Connect to a wide range of data sets, and “tidies up” the info it’s fed so that it can be better digested and understood.
- Reports and visuals data that can be shared with key users.
- Help users see not only what’s happened in the past and what’s happening in the present, but also what might happen in the future.
- Spot patterns in data and use those patterns to make informed predictions and run scenarios.
- Provide estimates to allow users to generate forecasts, and prepare the most useful KPIs.
Why you must use BI Power:
- Power BI can process your business huge quantities of data that other platforms would struggle to process.
- Power BI is cloud-based, so users can enjoys an updated intelligence capabilities and algorithms.
- Power BI will provide your business with real-time updated dashboards to solve problems as they occur and identify opportunities quickly.
- Power BI is a Secure and reliable connection data source to your data.
- Power BI will be an excellent tool to be integrated with artificial intelligence and machine learning.
- BI power will let you get insights in a quick and easy setup with no required training.
- BI power will provide alerts that can be set up on KPIs to keep users up to date important metrics and measurements.
Who use BI Power?
BI Power can be used by:
- Business intelligence professionals, who use it to create data models and reports and then sharing it throughout the organization.
- The common stakeholder rather than a data analyst as BI Power tool relies more on drag-and-drop and intuitive features to help teams build their visualizations.
- Power BI can also be used as a self-service tool by multiple branches of y
Data Needed:
Power BI works seemingly with every data in your business, so any area your business want to report on it will use all the data available.
BI Power works with common data of different departments:
- Finance
- Marketing
- Sales
- Human resources.
BI Power Features:
- Provide Customizable dashboards, Interactive reports, charts, and graphs for services like: Salesforce, Google Analytics, and Microsoft Dynamics.
- Feature of Q&A that allows users to ask questions using natural language to get answers in a specific graphical form.
- Providing Content Packs to share dashboards with the team and stakeholders.
- Delivering Ad Hoc reporting and analysis.
BI reporting
Ad Hock report:
Ad-hoc analysis is any business report or data analysis curated and created by users, as and when they need it. Ad-hoc analysis in business intelligence sits in stark contrast with the managed reports seen in the early days of business analytics, which relied on templates distributed by IT departments.
An ad-hoc analysis lets the user determine which data sources to pull from and how that data will be presented. One key distinguishing factor of ad-hoc analysis is its ability to offer completely customized analytics.
For this reason, ad-hoc analysis can run the gamut from a simple one-off data table all the way to intricately detail sales report using dashboards, interactive maps, and other advanced visualization features.
